In my previous posting, I looked at the performance of my predictor on a week-by-week basis throughout the season. This showed that performance was poor at the beginning of the season (when our knowledge about teams is most uncertain) and improved throughout the season (at least until play shifts to tournaments). Is there any way we can use this insight to improve performance?
One approach is to let the model try to correct for the week to week differences. To do this, the model needs to know the week of the season for each game. But it isn't sufficient to simply have a feature with the week value (e.g., WEEK_OF_SEASON=22) because most models (and linear regression in particular) will treat that feature as a continuous value and be unable to apply a specific correction for a specific week. The solution to this is to use "one hot encoding".
One hot encoding is applicable to any sort of categorical feature -- a feature with distinct values that represent different categories, such as week in the season, day of the week, etc. One hot encoding splits the categorical feature up into a number of new features, one for each possible value of the categorical feature. For example, DAY_OF_THE_WEEK would get split into 7 new features. For each example in our data set, the appropriate feature is set to 1 while all the other features are set to 0. For a game that took place on Tuesday, the new feature DAY_OF_THE_WEEK_2 would get set to 1 (assuming Sunday is Day Zero), and DAY_OF_THE_WEEK_0, DAY_OF_THE_WEEK_1, etc. would get set to 0.
Once we've hot encoded the WEEK_OF_SEASON the model can correct on a week-by-week basis. However, whatever correction the model applies will apply to every game that week, so this approach is only suitable to correct any overall bias for that week. If the error in the week is completely random, this approach won't help.
So is there a weekly bias (at least in my model)?
The following chart shows the Absolute Error for my model each week both before (red) and after (blue) applying this technique.

As you can see, in many weeks before applying the correction there's significant bias. Afterwards the bias is reduced to near zero. That's not surprising -- essentially what a linear regressor will do in this situation is set the new feature to be worth the negative of the mean bias, thus it will exactly cancel the bias.
Adding the hot-encoded WEEK_OF_SEASON eliminates weekly bias, but it doesn't eliminate more complex errors. A potentially better approach to reducing early season error is to add more reliable information about the strength of teams in the early season. But until teams play some games, how can we know how good they are? An obvious approach is to guess that they're about as good as they were the previous season. This isn't a perfect proxy -- after all, teams do get better or worse from season to season -- but there is a strong correlation between seasons, so it's generally a pretty good guess.
But there's a problem with just throwing data from the previous season into our model. We really only want the model to use the old data until the new data is better than the old data. It's fairly straightforward to figure out when that happens -- we run the model once on the old data and once on the new data, and look for where the new data starts to outperform the old data. But what's not easy is to stop using the old data in the model. You can't change the number of features in your training data halfway through building a model!
There are several ways you might address this problem. You could have two models, one that uses the old data up to the crossover point, and another only uses the new data after that point. You could use a weighted moving average, and start the year with the old data and gradually replace it with the new data. Or you could have both the old data and the new data in the model, but replace the old data with the new data once you hit the crossing point.
I've tried all of these approaches. Having two models is very cumbersome and creates a lot of workflow problems. The second is the most intellectually appealing, but I've never been able to get it to perform well. The third approach is simple and flexible, but has the drawback that after the crossing point the new data is in the model twice. Despite that drawback, this approach has worked the best for me.
The plot below shows the mean squared error for the model both before (red) and after (blue) adding in data from the previous season.
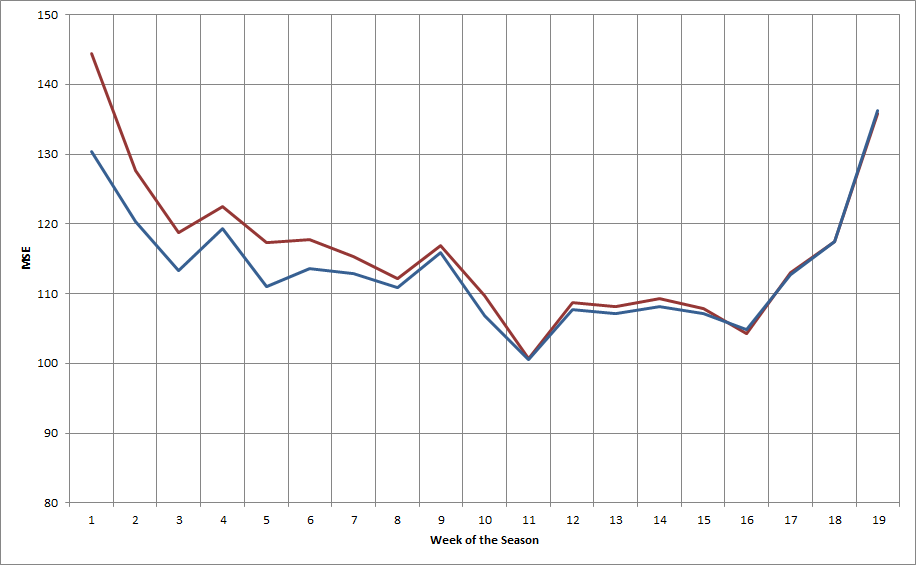
As you would expect, this shows the most improvement early in the season -- quite dramatically in the first few weeks -- and tapers off after that. In this case, the cutoff is in the 12th week of the season. After that the impact of the old data is eliminated.
It's also interesting to look at how the old data impacts performance against the spread:

(In this graph, bigger is better.) In this case, the addition of the previous season's data helps our performance against the spread through about the first ten weeks (and nearly eliminates the anomalous performance in Week 5). Interestingly enough, this actually hurts performance slightly after Week 16.
Overall, accounting for week-by-week bias and using the previous season's data to improve early season predictions is an effective approach. It should be noted, though, that the overall improvement from these changes are modest: about 0.10 point in RMSE and less than 1% in WATS.
An interesting line of speculation is whether it is possible to easily improve the value of the previous season's data. For example, it's reasonable to expect that from year-to-year teams will tend to "regress to the mean". If that's true, regressing the previous year's data towards the mean might further improve performance.
No comments:
Post a Comment
Note: Only a member of this blog may post a comment.